Weekly Market Commentary
May 27th, 2025
Week in Review…
Markets started last week on a quiet note but quickly shifted gears as a flurry of economic data arrived in the second half. Key reports on housing, business sentiment, and inflation expectations gave investors fresh insight into the state of the economy—and where it might be headed.
Housing data was mixed but revealing. April’s existing home sales came in at 4.0 million, slightly below the 4.15 million forecast but flat from March, suggesting some stability. In contrast, new home sales surprised to the upside at 743,000, well above the 694,000 estimate and up 10.9% month-over-month. Adding to the optimism, building permits were revised upward, hinting that builders may be more confident about future demand than previously thought.
Thursday’s preliminary May Purchasing Managers’ Index (PMI) data showed improving sentiment in both manufacturing and services. Manufacturing, in particular, saw a notable shift from pessimism to cautious optimism, suggesting purchasing managers may be regaining confidence after a rocky April.
Treasury auctions last week offered fresh insight into market sentiment around inflation and credit risk. Yields on the 20-year bond and 10-year Treasury Inflation-protected Securities (TIPS) moved higher, but the rise appears more closely tied to shifting inflation expectations than to concerns over credit quality. This is particularly notable given Moody’s downgrade of U.S. credit earlier this month, a move that initially raised some alarms. However, the concurrent rise in 10-year breakeven rates suggests markets are more focused on inflation risks than on a deteriorating credit profile.
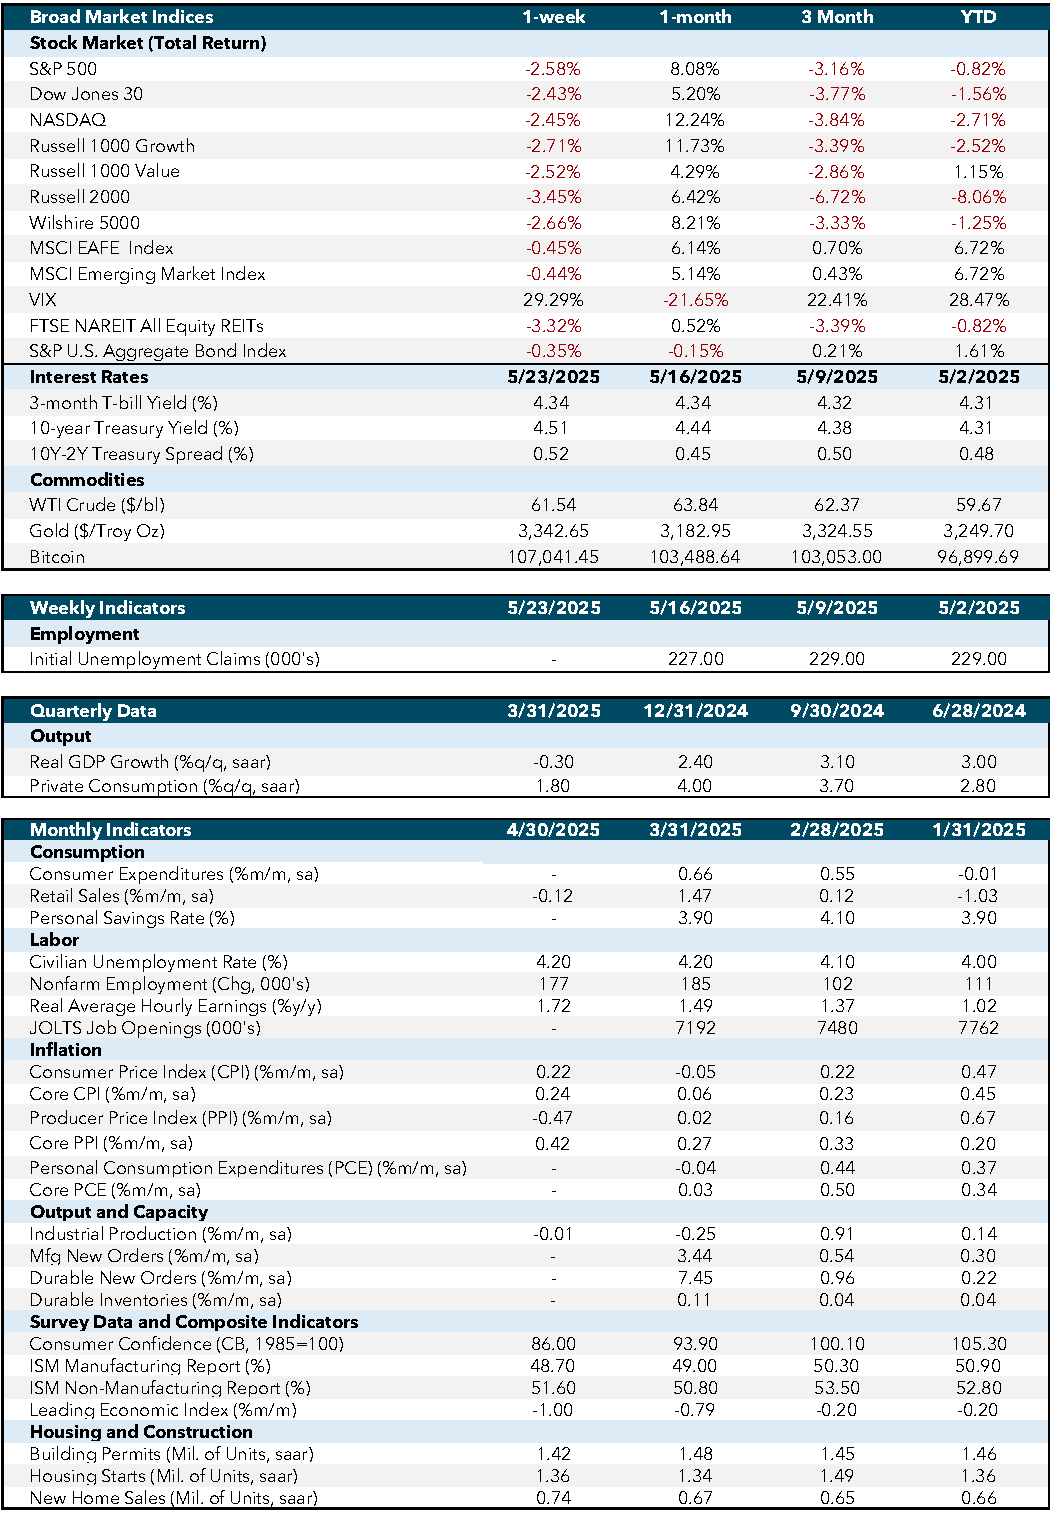
Economic and Capital Markets Dashboard
Week Ahead…

Markets paused Monday for the Memorial Day holiday but resume with a full slate of economic data as investors assess shifting dynamics in the U.S. and global economies.
The spotlight will be on Friday’s inflation data, with both Headline and Core Personal Consumption Expenditures (PCE) reports due. As the Fed’s preferred inflation gauge, Core PCE – adjusted for changing consumer behavior – will be closely watched. Later that day, the University of Michigan will release revised 1- and 5-year inflation expectations. The preliminary report earlier this month exceeded forecasts, and markets will be watching for any sentiment shifts, especially in light of recent tariff developments. These inflation readings will be accompanied by consumer sentiment and expectations data, offering further insight into the demand side of the economy.
Consumer health remains a key focus. On Tuesday, the Conference Board will release its Consumer Confidence Index, a measure of how optimistic consumers feel about the economy. Optimism tends to support stronger spending, which drives gross domestic product (GDP) growth. On Friday, markets will get a more concrete view of consumer behavior with the release of the personal spending report, which tracks changes in total consumer expenditures. Together, these reports will help gauge the strength of the retail consumer and, by extension, the broader economy.
On the business front, Tuesday brings data on both Headline and Core Durable Goods Orders. Strong readings here suggest rising manufacturing activity and a resilient labor market. Then on Friday, retail inventories data will offer a look at business inventory trends, particularly whether firms are continuing to front-load orders in anticipation of potential tariff impacts.
Economic Indicators:
- CPI: Consumer Price Index measures the average change in prices paid by consumers for goods and services over time. Source: Bureau of Labor Statistics.
- Core CPI: Core Consumer Price Index excludes food and energy prices to provide a clearer picture of long-term inflation trends. Source: Bureau of Labor Statistics.
- PPI: Producer Price Index measures the average change in selling prices received by domestic producers for their output. Source: Bureau of Labor Statistics.
- Core PPI: Core Producer Price Index excludes food and energy prices to provide a clearer picture of long-term inflation trends. Source: Bureau of Labor Statistics.
- PCE: Personal Consumption Expenditures measure the average change in prices paid by consumers for goods and services. Source: Bureau of Economic Analysis.
- Core PCE: Core Personal Consumption Expenditures exclude food and energy prices to provide a clearer picture of long-term inflation trends. Source: Bureau of Economic Analysis.
- Industrial Production: Measures the output of the industrial sector, including manufacturing, mining, and utilities. Source: Federal Reserve.
- Mfg New Orders: Measures the value of new orders placed with manufacturers for durable and non-durable goods. Source: Census Bureau.
- Durable New Orders: Measures the value of new orders placed with manufacturers of durable goods. Source: Census Bureau.
- Durable Inventories: Measures the value of inventories held by manufacturers for durable goods. Source: Census Bureau.
- Consumer Confidence (CB, 1985=100): Measures the degree of optimism that consumers feel about the overall state of the economy and their personal financial situation. Source: Conference Board.
- ISM Manufacturing Report: Measures the economic health of the manufacturing sector based on surveys of purchasing managers. Source: Institute for Supply Management.
- ISM Non-Manufacturing Report: Measures the economic health of the non-manufacturing sector based on surveys of purchasing managers. Source: Institute for Supply Management.
- Leading Economic Index: Measures overall economic activity and predicts future economic trends. Source: Conference Board.
- Building Permits (Mil. of Units, saar): Measures the number of new residential building permits issued. Source: Census Bureau.
- Housing Starts (Mil. of Units, saar): Measures the number of new residential construction projects that have begun. Source: Census Bureau.
- New Home Sales (Mil. of Units, saar): Measures the number of newly constructed homes sold. Source: Census Bureau.
- SA: Seasonally adjusted.
- SAAR: Seasonally adjusted annual rate.
Market Indices & Indicators:
- S&P 500: A market-capitalization-weighted index of 500 leading publicly traded companies in the U.S., widely regarded as one of the best gauges of large U.S. stocks and the stock market overall.
- Dow Jones 30: Also known as the Dow Jones Industrial Average, it tracks the share price performance of 30 large, publicly traded U.S. companies, serving as a barometer of the stock market and economy.
- NASDAQ: The world’s first electronic stock exchange, primarily listing technology giants and operating 29 markets globally.
- Russell 1000 Growth: Measures the performance of large-cap growth segment of the U.S. equity universe, including companies with higher price-to-book ratios and growth metrics.
- Russell 1000 Value: Measures the performance of large-cap value segment of the U.S. equity universe, including companies with lower price-to-book ratios and growth metrics.
- Russell 2000: A market index composed of 2,000 small-cap companies, widely used as a benchmark for small-cap mutual funds.
- Wilshire 5000: A market-capitalization-weighted index capturing the performance of all American stocks actively traded in the U.S., representing the broadest measure of the U.S. stock market.
- MSCI EAFE Index: An equity index capturing large and mid-cap representation across developed markets countries around the world, excluding the U.S. and Canada.
- MSCI Emerging Market Index: Captures large and mid-cap representation across emerging markets countries, covering approximately 85% of the free float-adjusted market capitalization in each country.
- VIX: The CBOE Volatility Index measures the market’s expectations for volatility over the coming 30 days, often referred to as the “fear gauge.”
- FTSE NAREIT All Equity REITs: Measures the performance of all publicly traded equity real estate investment trusts (REITs) listed in the U.S., excluding mortgage REITs.
- S&P U.S. Aggregate Bond Index: Represents the performance of the U.S. investment-grade bond market, including government, corporate, mortgage-backed, and asset-backed securities.
- 3-Month T-bill Yield (%): The yield on U.S. Treasury bills with a maturity of three months, reflecting short-term interest rates.
- 10-Year Treasury Yield (%): The yield on U.S. Treasury bonds with a maturity of ten years, reflecting long-term interest rates.
- 10Y-2Y Treasury Spread (%): The difference between the yields on 10-year and 2-year U.S. Treasury bonds, often used as an indicator of economic expectations.
- WTI Crude ($/bl): The price per barrel of West Texas Intermediate crude oil, a benchmark for U.S. oil prices.
- Gold ($/Troy Oz): The price per troy ounce of gold, a standard measure for gold prices.
- Bitcoin: A decentralized digital currency without a central bank or single administrator, which can be sent from user to user on the peer-to-peer bitcoin network.
This content was developed by Cambridge from sources believed to be reliable. This content is provided for informational purposes only and should not be construed or acted upon as individualized investment advice. It should not be considered a recommendation or solicitation. Information is subject to change. Any forward-looking statements are based on assumptions, may not materialize, and are subject to revision without notice. The information in this material is not intended as tax or legal advice.
Investing involves risk. Depending on the different types of investments there may be varying degrees of risk. Socially responsible investing does not guarantee any amount of success. Clients and prospective clients should be prepared to bear investment loss including loss of original principal. Indices mentioned are unmanaged and cannot be invested into directly. Past performance is not a guarantee of future results.
The Dow Jones Industrial Average (DJIA) is a price-weighted index composed of 30 widely traded blue-chip U.S. common stocks. The S&P 500 is a market-cap weighted index composed of the common stocks of 500 leading companies in leading industries of the U.S. economy. The NASDAQ Composite Index is a market-value weighted index of all common stocks listed on the NASDAQ stock exchange.
Securities offered through Cambridge Investment Research, Inc., a broker-dealer, member FINRA/SIPC, and investment advisory services offered through Cambridge Investment Research Advisors, Inc., a Registered Investment Adviser. Both are wholly-owned subsidiaries of Cambridge Investment Group, Inc. V.CIR.0525-1641